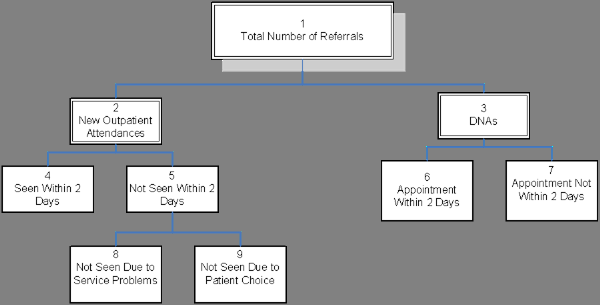
Note: The numbers in the right hand column of the table relate to the explanatory diagram below.
|
Total number of referral requests received |
1 |
|
Number of new outpatient attendances |
2 |
|
Number of new outpatient attendances seen within 2 working days from receipt of referral |
4 |
|
Number of new outpatient attendances not seen within 2 working days from receipt of referral |
5 |
|
Number of new outpatient attendances not seen within 2 working days from receipt of referral because they were not offered an appointment within 2 days |
8 |
|
Number of new outpatient attendances not seen within 2 working days from receipt of referral because of patient choice i.e. the patient declined an appointment offered within 2 working days from receipt of referral. |
9 |
|
Number of patients with a new outpatient appointment who did not attend and failed to give advance warning. Refer to the Guide to Good Practice for additional guidance. |
3 |
|
Number of Patients with a new outpatient appointment offered within 2 working days of receipt of referral who did not attend |
6 |
|
Number of patients with a new outpatient appointment that was not offered within 2 working days of receipt of referral who did not attend. |
7 |
* 4 + 9 + 6 = Number of Referrals where Appointment Offered within 2 Working Days.
Explanatory Diagram